
ASL pulse sequence
Dr. Wang has been disseminating ASL sequences to over 100 Siemens
research sites around the world. Please email Dr. Wang if you are
interested in obtaining the latest pseudo-continuous ASL sequence
and/or collaboration using the various techniques developed at LOFT.
Please include the follow information in your request:
MATLAB code: R2diff significance test for double-peak pattern
This MATLAB code (R2diff_test) is developed for significance test of double-peak pattern. R2diff_test calculates adjusted R2 for input data (laminar profile) from curve fitting assuming two or single Gaussian distributions. Larger R2diff indicates the profile can be better described as two peaks instead of a single peak. Statistical significance of the R2diff can be estimated by Boot strapping runs with random noise.
Environment requirement
This package requires Matlab.
Download
The software is free, but we hope that users register to download the software in order to help us track its usage.
Reference
- Shao, X., et al (2021). Laminar perfusion imaging with zoomed arterial spin labeling at 7 Tesla. NeuroImage.
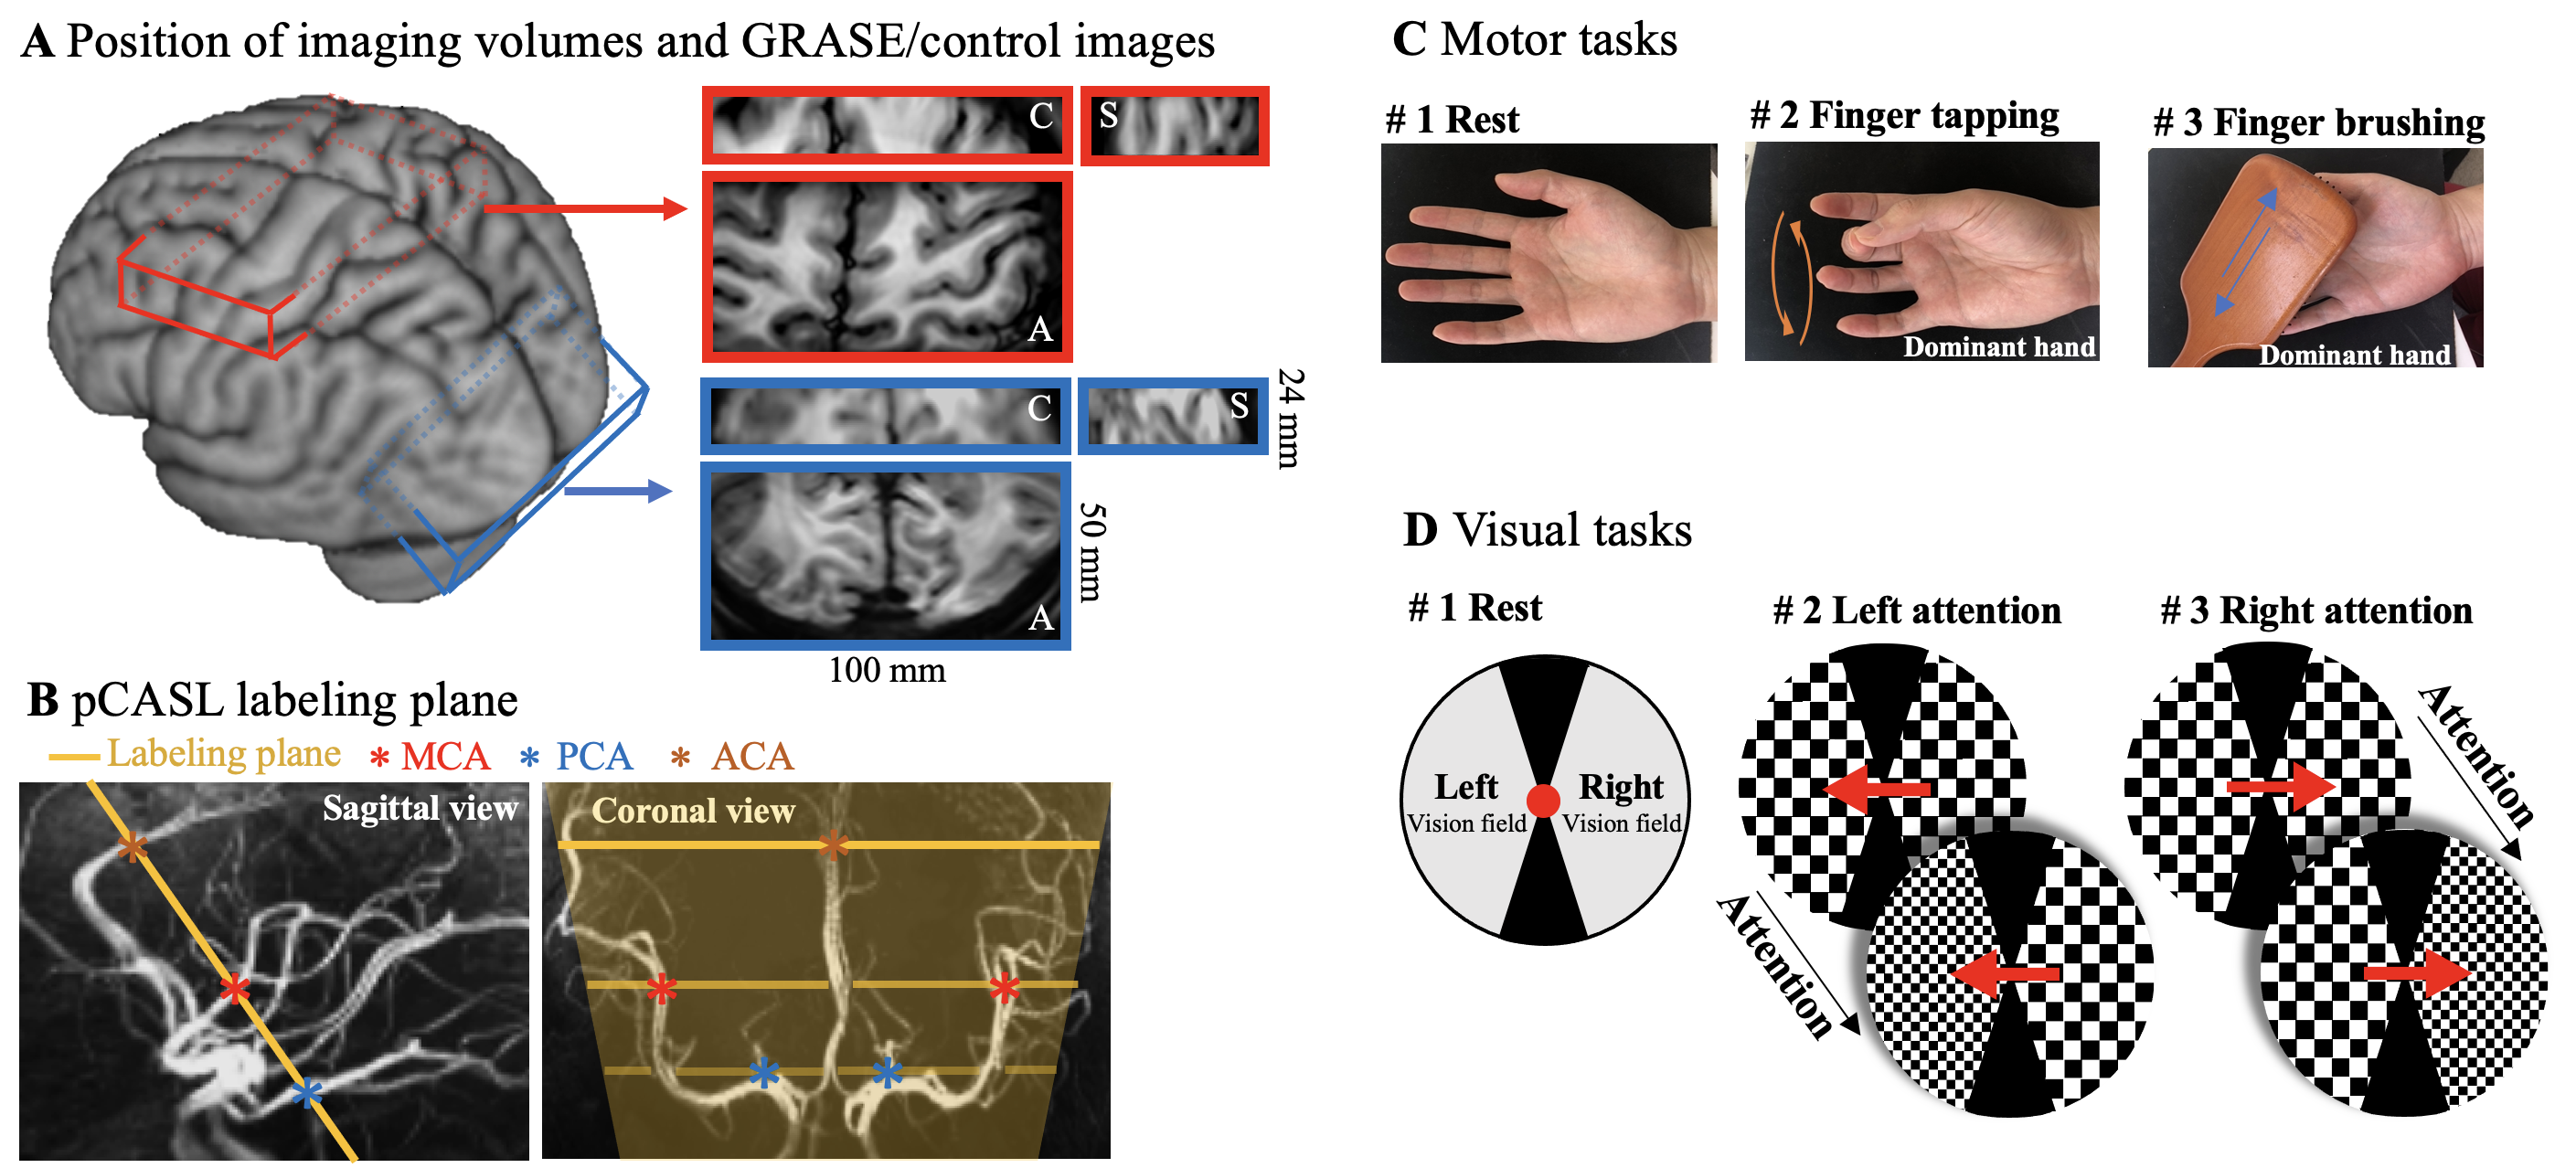
7T laminar ASL data
This folder contains laminar ASL data presented in Shao X., et al., (2021). Laminar perfusion imaging with zoomed arterial spin labeling at 7 Tesla. NeuroImage. M1/S0X (1-6) folders contain multi-delay resting state and activation ASL scans with finger tapping (FT) and finger brushing (FB) tasks. And V1/S0X (1-6) folders contain multi-delay resting state and activation ASL scans with attended stimulus in left (L) or right (R) visual field. For details, please refer to data_info.docx.
Pulse sequence
The pulse sequence was developed under Siemens IDEA environment (ver. VE12U) and tested on Siemens 7T Terra scanner with 1Tx coil. The pulse sequence will be available after we establish Material Transfer Agreement (MTA) between user's institute and University of Southern California. Please contact Dr. Danny JJ Wang for more information: jj.wang@loni.usc.edu
Download
The data is free to download, but we hope that users register to download the data in order to help us track its usage.
Reference
- Shao, X., et al (2021). Laminar perfusion imaging with zoomed arterial spin labeling at 7 Tesla. NeuroImage.
7T whole brain 3D pCASL
This folder contains the Matlab scripts used for data analysis and experimental data presented in the manuscript “Whole-Brain distortion-free three-dimensional pseudo-Continuous Arterial Spin Labeling at 7T” that was submitted to NeuroImage.
Download
The data is free to download, but we hope that users register to download the data in order to help us track its usage.
Dataset for comparison of vessel density image (VDI) between young and aged groups
This folder contains the dataset for comparison of vessel density image (VDI) between young and aged groups, which is described in the publication (https://www.biorxiv.org/content/10.1101/2023.03.18.533300v2).
Download
The data is free to download, but we hope that users register to download the data in order to help us track its usage.
Deep Learning-based ASL denoising
Background of ASL denoising with deep learning
The greatest challenges for ASL are its low SNR and accuracy for quantification of CBF. Therefore, the main tasks for ASL data processing are denoising the perfusion images and precise quantification. ASL has some special characteristics compared to other MRI modalities. First, although the primary outcome for an ASL acquisition is a perfusion weighted image, the raw data is obtained in a 4D fashion, with several 3D volumes of paired control and label images and are often acquired along with a proton density image (M0) as reference for CBF quantification. This makes ASL images to contain both spatial and temporal information, which can be potentially utilized in post processing. There have been studies developing spatiotemporal denoising and reconstruction of ASL images with spatiotemporal regularizers such as TGV. However, applying DL algorithms on spatiotemporal denoising would be computationally expensive and hard to train with limited data. Current studies on ASL denoising always focused on image-to-image translation, but not fully utilized the temporal information. Second, quantification of CBF and other parameters of ASL is usually done through a model fitting process. The models used for fitting are well established that follows the dynamics of the T1 decay of blood and tissue. However, theoretical model may not reflect in-vivo data, which may contain various kind of noise and artifact. Also, the calculation of CBF may be time-consuming, especially for multi-delay ASL. Therefore, some studies have been investigating to apply DL algorithm to bypass the model fitting steps and directly achieve quantitative maps from the acquired perfusion images.
The proposed pipeline for flexible ASL denoising with deep learning
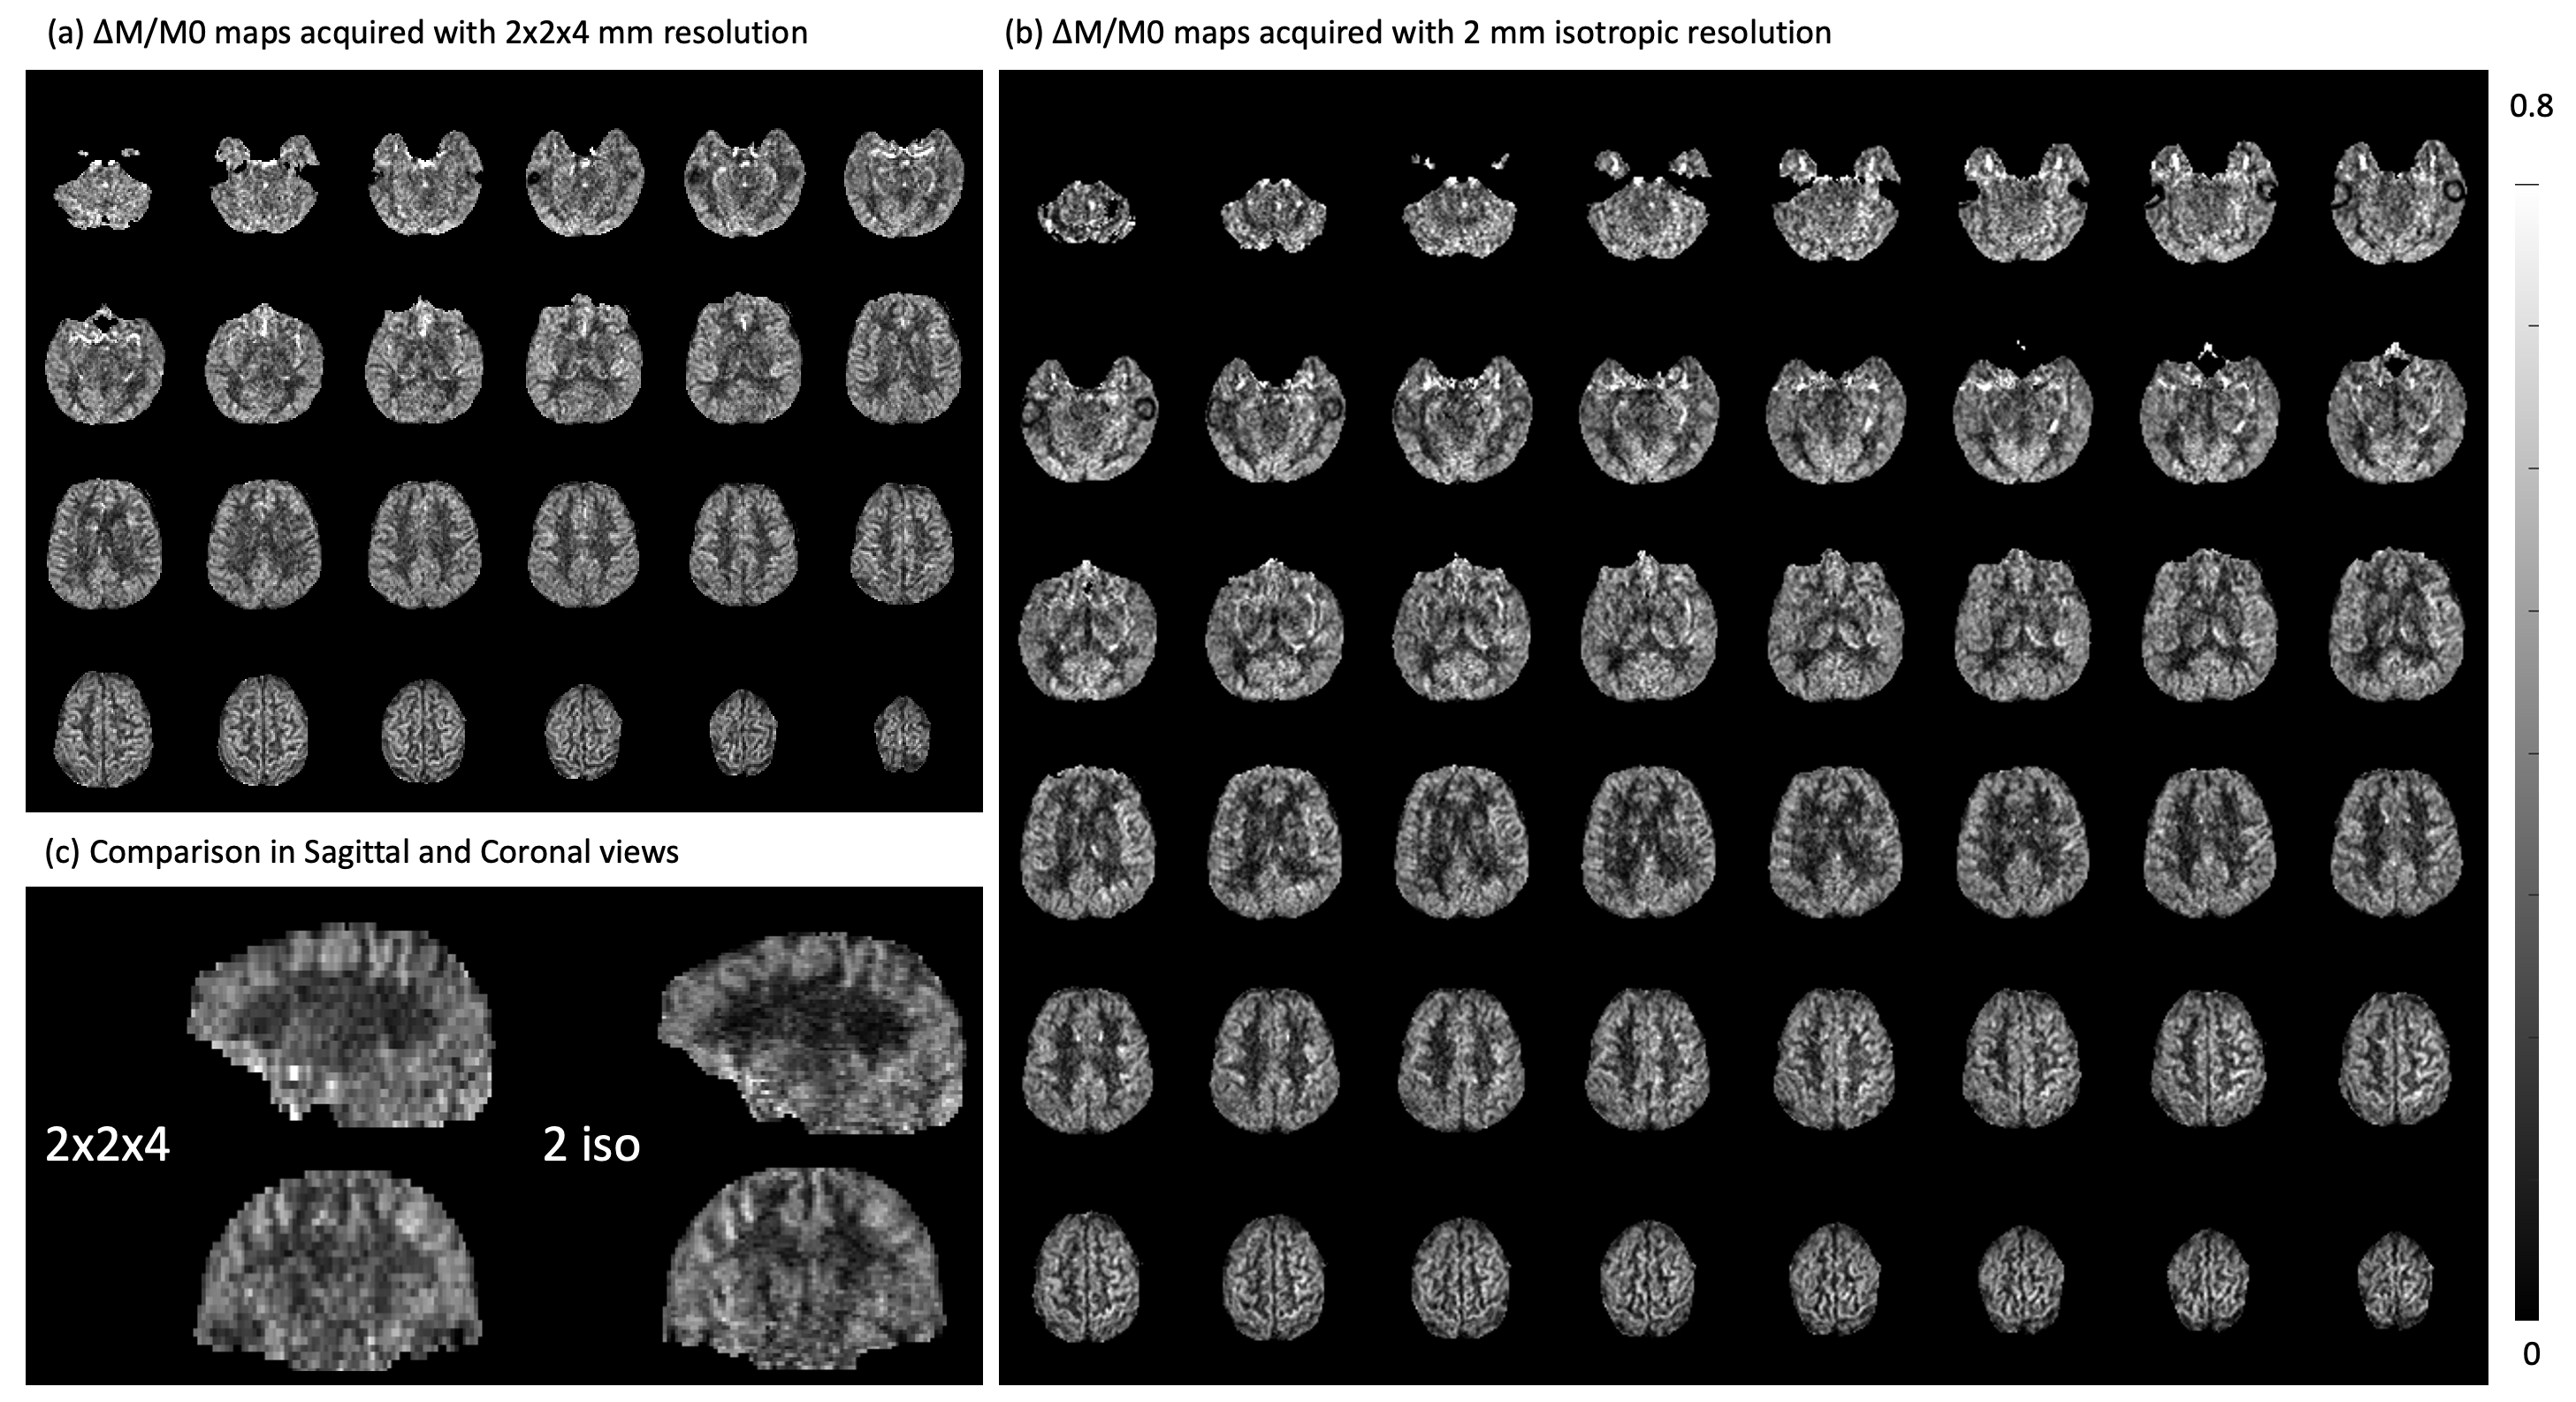
Our proposed denoising scheme will denoise each frame of the perfusion series independently, and then can be averaged with different number of measurements for further SNR improvement. Since it would require sufficient SNR for the single perfusion image to be a meaningful input, we choose 3D ASL data as our subject of interest. 3D acquisition is also recommended by the ASL white paper and is currently most widely used in clinic. Furthermore, this scheme also allows to be adapted to a multi-delay denoising freely, as there are usually less repetitions for each delay in a multi-delay acquisition. Based on the preliminary data shown below, we feel it possible to use each perfusion image as the input for our denoising scheme. The pipeline is illustrated in the following figure:
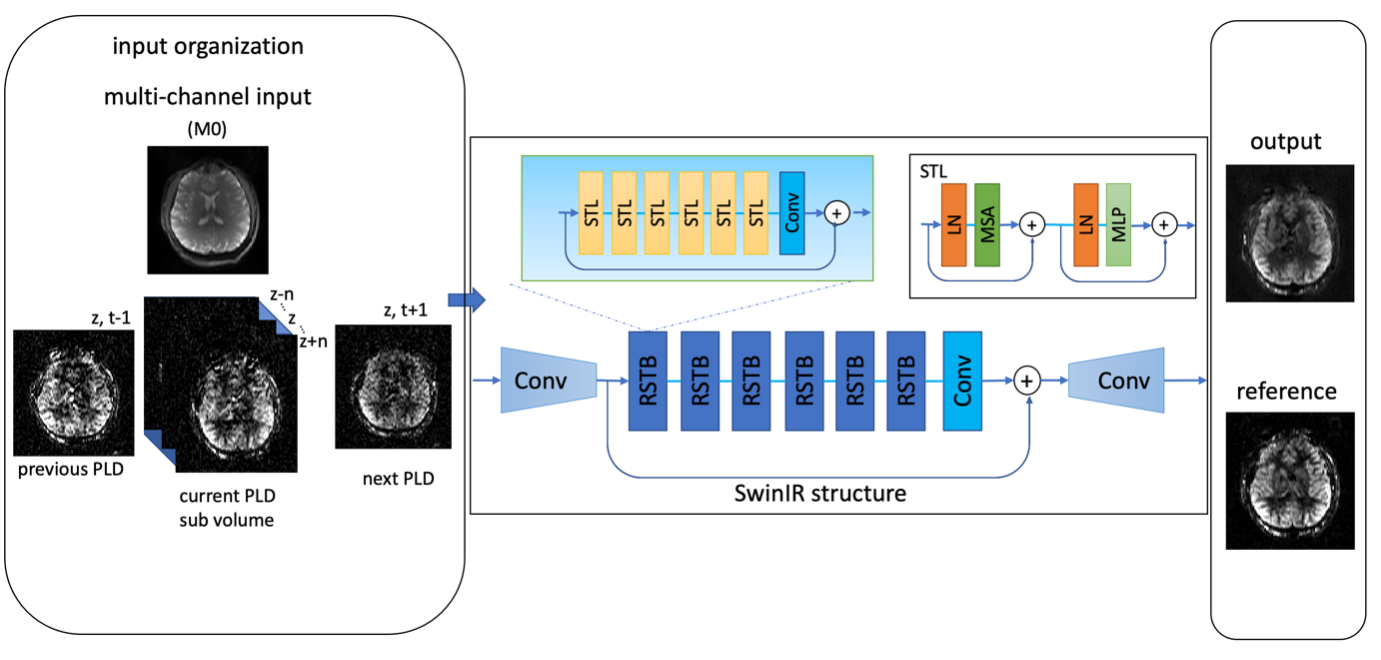
In this work, we used a pseudo-3D input and a Swin Transformer structure to perform flexible ASL denoising for both single-delay and multi-delay ASL. The details of the work can be found in the reference paper at bottom.
Code
The code for training and inference with sample data and model can be found in the following link: https://github.com/qinyangshou/DL_ASL_denoising
Reference
Please consider cite the following paper:
Shou Q, Zhao C, Shao X, Jann K, Helmer K, Lu H, Wang DJ. Transformer based deep learning denoising of single and multi-delay 3D Arterial Spin Labeling. medRxiv. 2023:2023-04.
DTI-ALPS processing pipeline
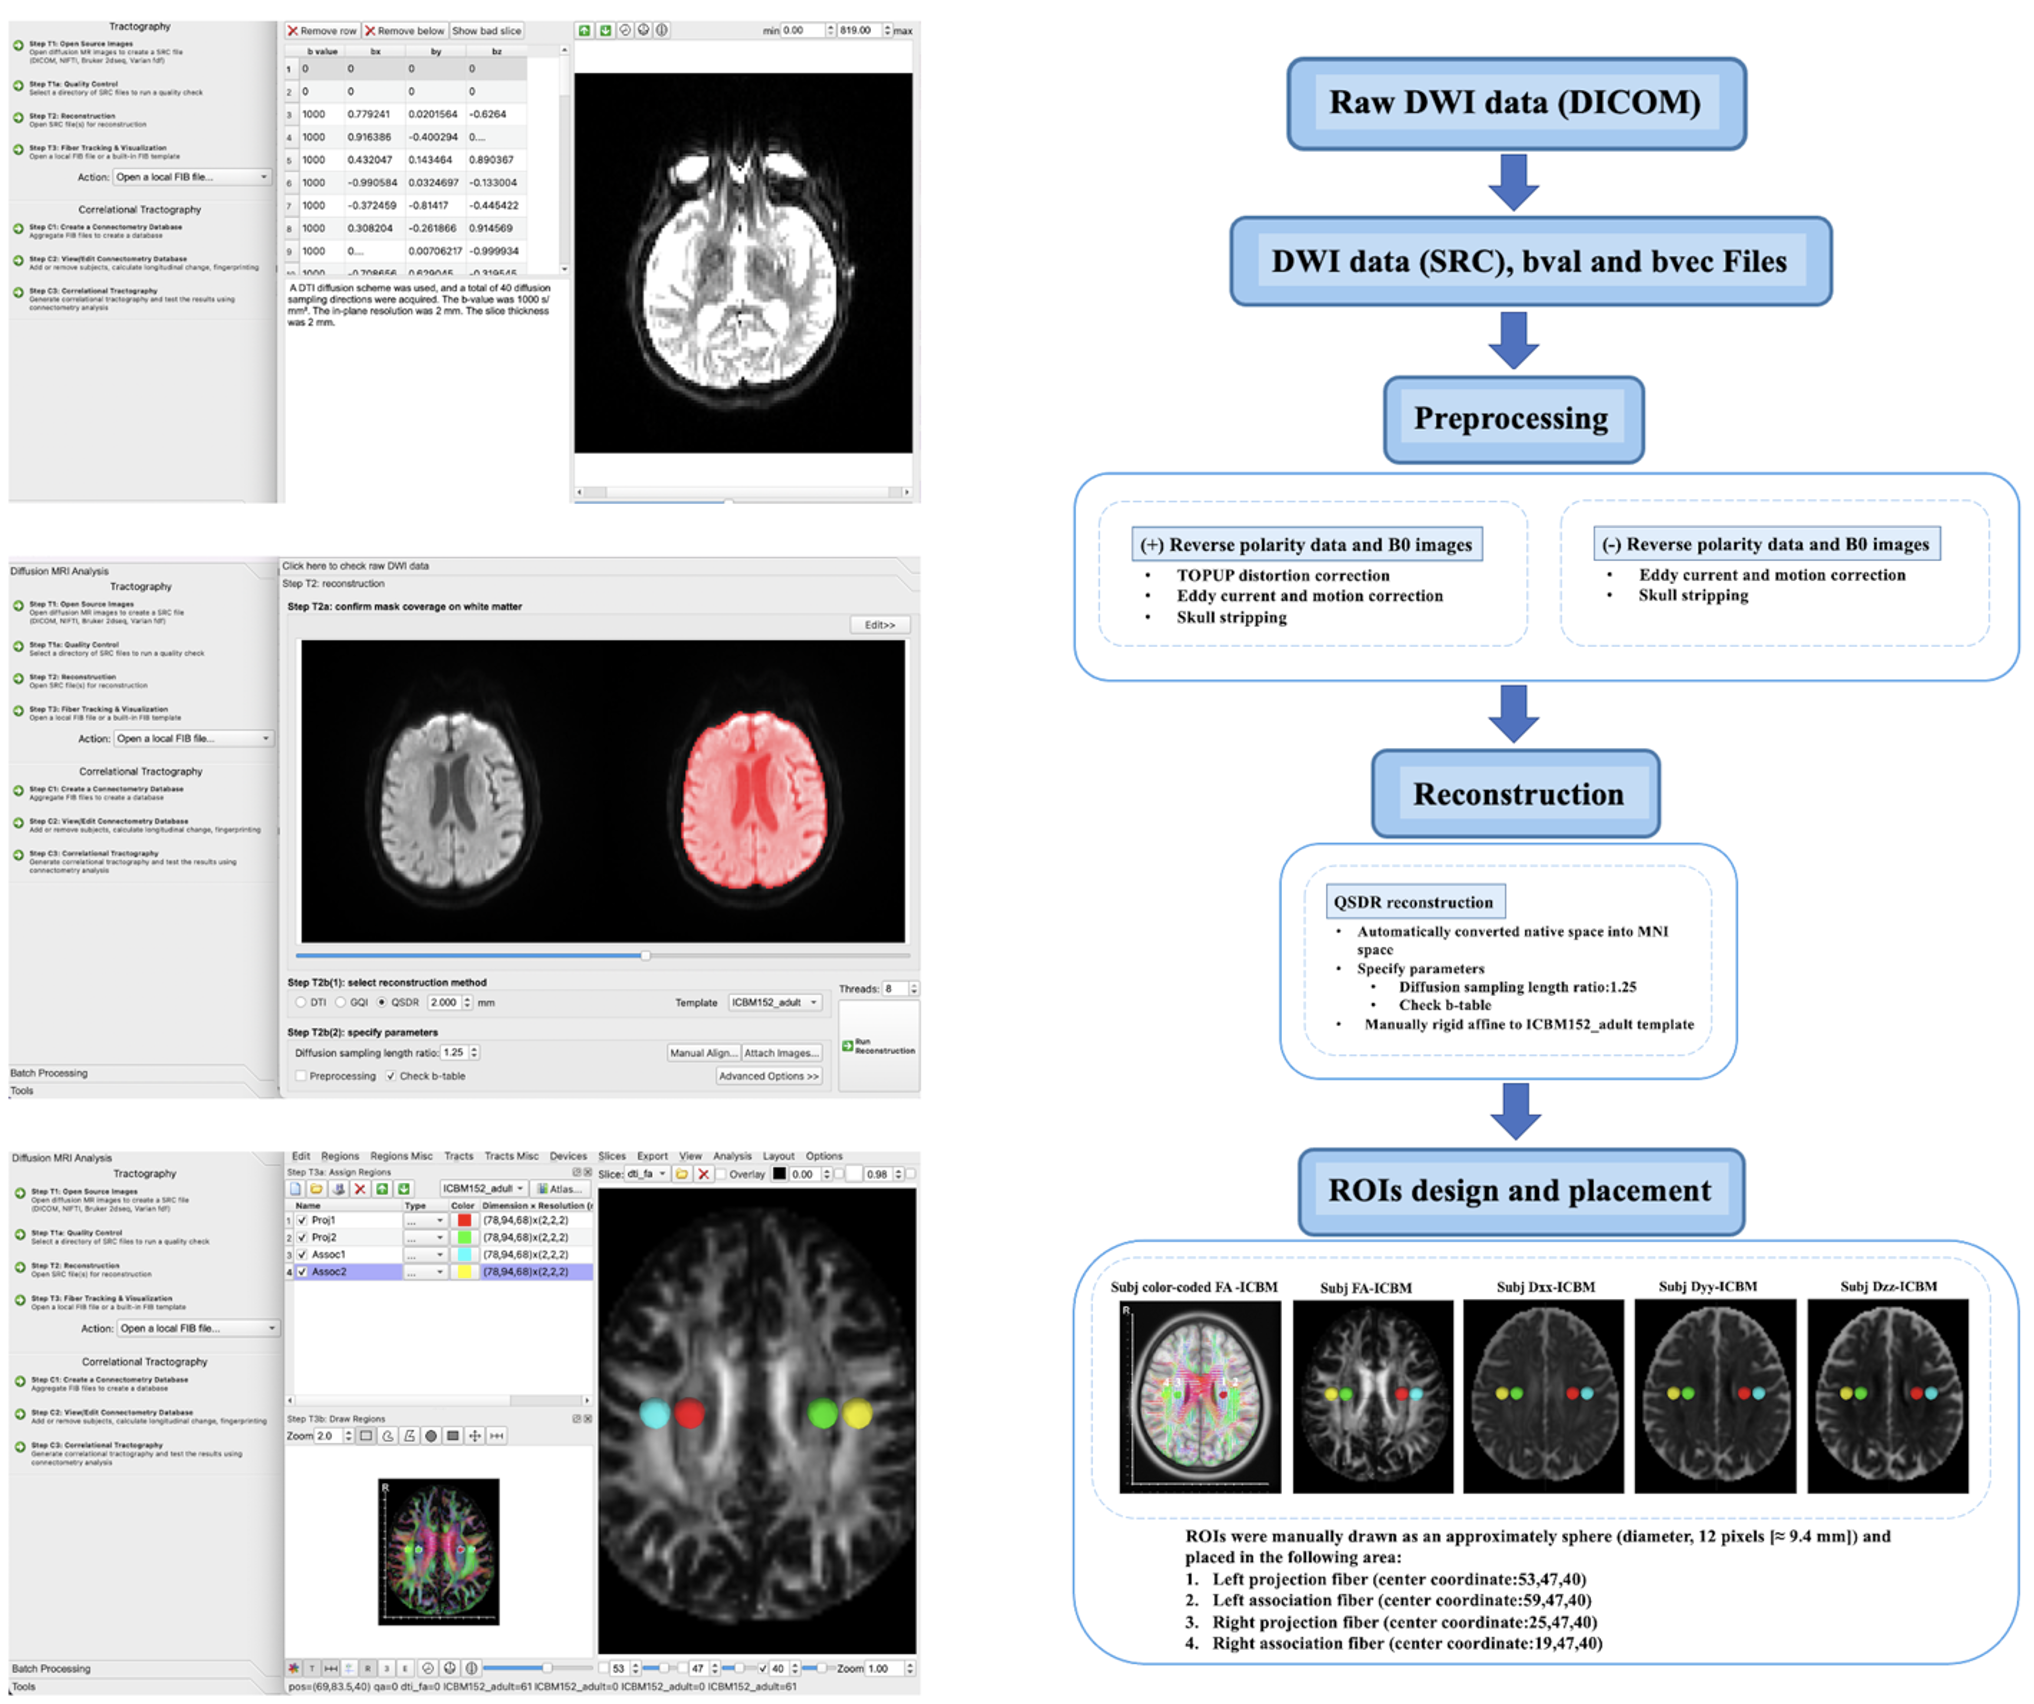
Background of DTI-ALPS method The diffusion tensor image analysis along the perivascular space (DTI-ALPS) is a method proposed by using diffusion MRI for non-invasive evaluation of the clearance function of glymphatic system (GS). In this method, the motion of water molecules in the direction of the perivascular space is assessed by measuring respective diffusivity. The perivascular space is hypothesized to run the same direction as the medullary veins at the level of the lateral ventricle body that run perpendicular to the ventricle wall. This right-left direction is defined as x-axis. On the plane of this area, the adjacent projection fibers run in the head-foot direction and association fibers run in the anterior-posterior direction, which are orthogonal to the direction of perivascular space and defined as y-axis and z-axis respectively (See figure below) [1].
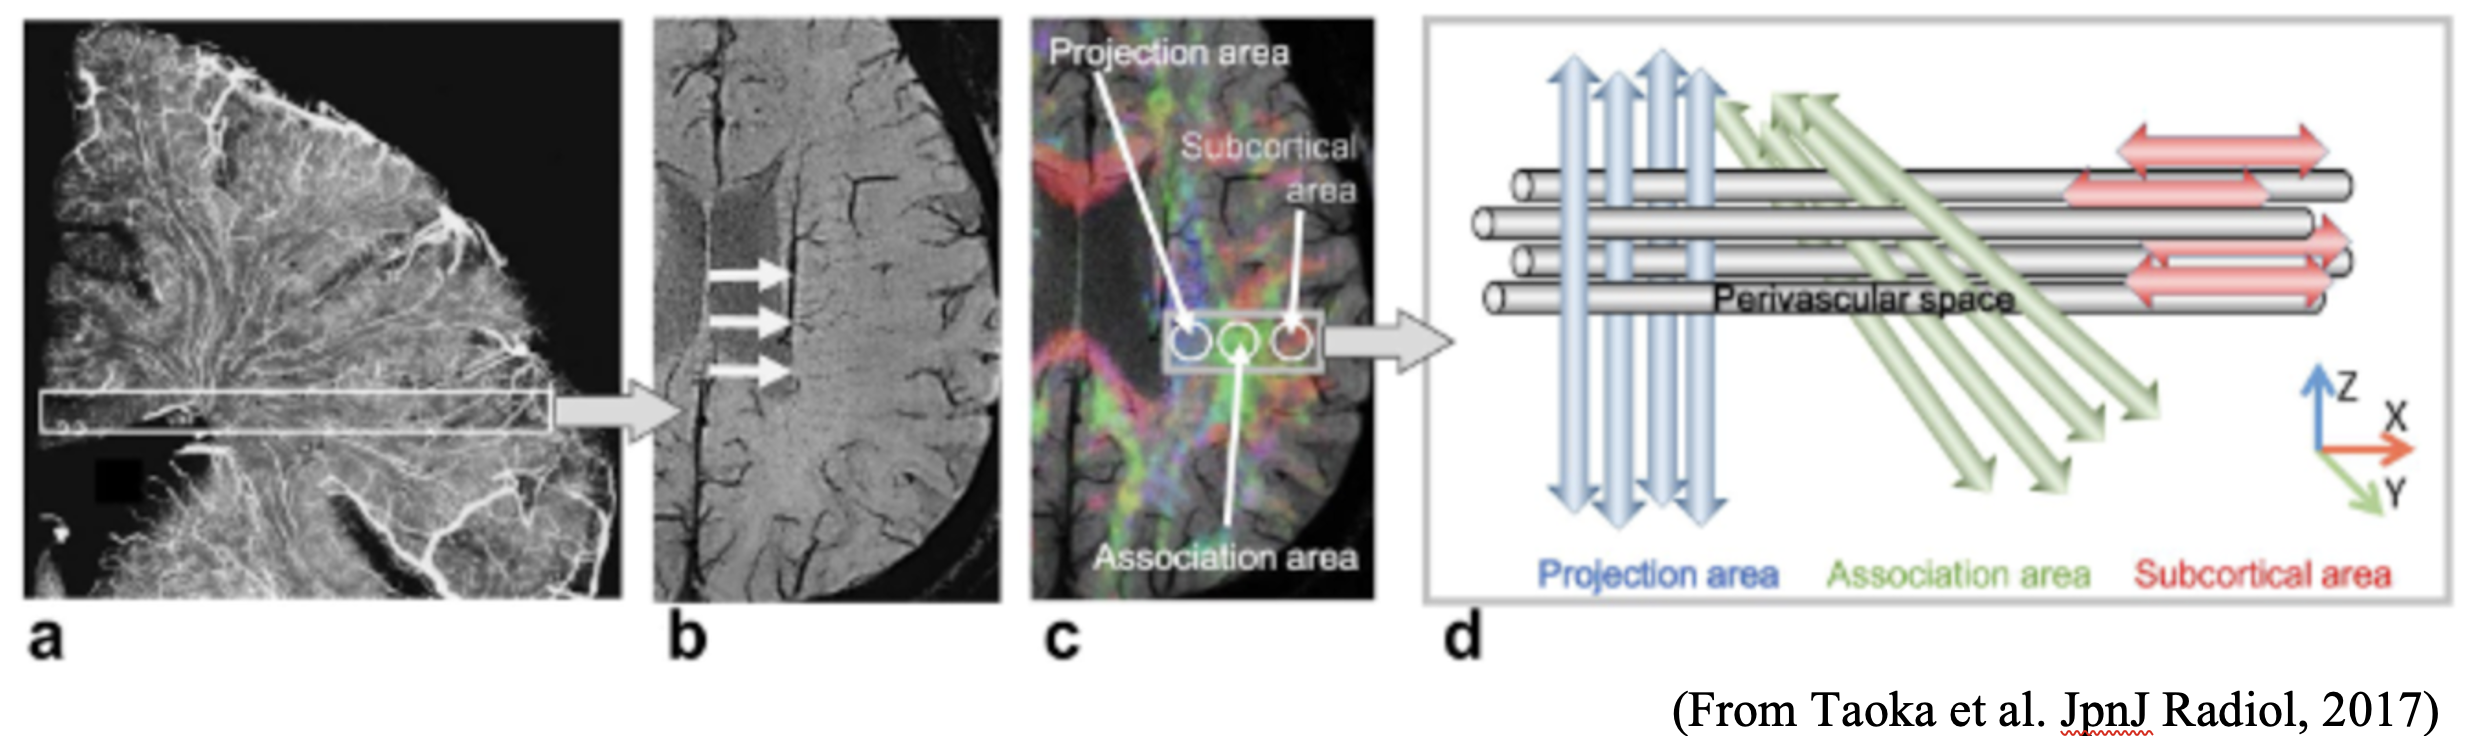
When there’s histological changes along the direction of perivascular space, it will affect diffusivity of both projection and association fibers. The ALPS index is therefore defined by the ratio of the mean of x-axis diffusivity in the area of projection fibers (Dxproj) and x-axis diffusivity in the area of association fibers (Dxassoc) to the mean of the y-axis diffusivity in the area of projection fibers and z-axis diffusivity in the area of association fibers (Dzassoc) (See formula below) [1]:
ALPS index = mean(Dxxproj, Dxxassoc) / mean(Dyyproj, Dzzassoc)
Introduction of the DTI-ALPS processing pipeline Here we provide two pipelines for DTI-ALPS processing by using DSI Studio graphic-user interface software (DSI Studio GUI; https://dsi-studio.labsolver.org/) and FMRIB software Library version 6.0 (FSL; Oxford Centre for Functional MRI of the Brain, Oxford, UK; https://fsl.fmrib.ox.ac.uk/fsl/).
(1) DSI Studio pipeline
In this pipeline, all the processing steps are performed with DSI Studio GUI. The workflow of DSI Studio pipeline is shown as follows:
(2) FSL pipeline
The FSL pipeline is a bash script to compute the ALPS index using the DTI images as input and including FSL and MRtrix3 commands. The workflow of FSL pipeline is shown as follows:
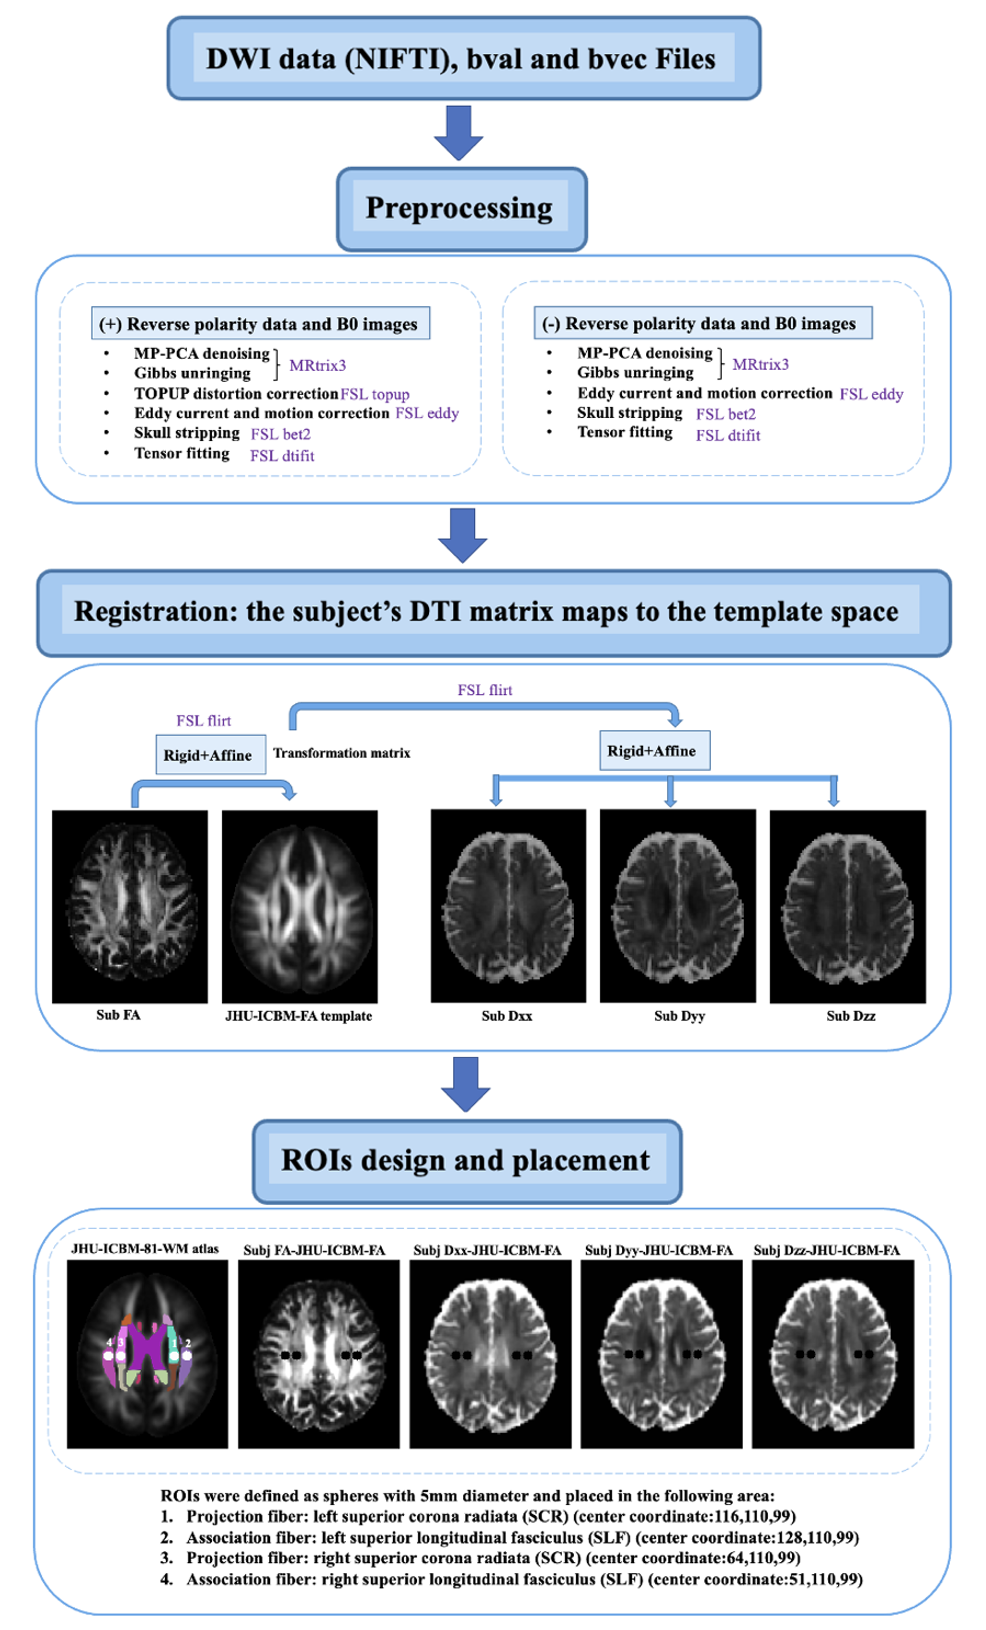
Download
The bash script is free to download via the following link: https://github.com/gbarisano/alps.
Reference
1. Taoka T, Masutani Y, Kawai H, Nakane T, Matsuoka K, Yasuno F, et al. (2017). Evaluation of glymphatic system activity with the diffusion MR technique: diffusion tensor image analysis along the perivascular space (DTI-ALPS) in Alzheimer’s disease cases. Jpn J Radiol, 35:172–178
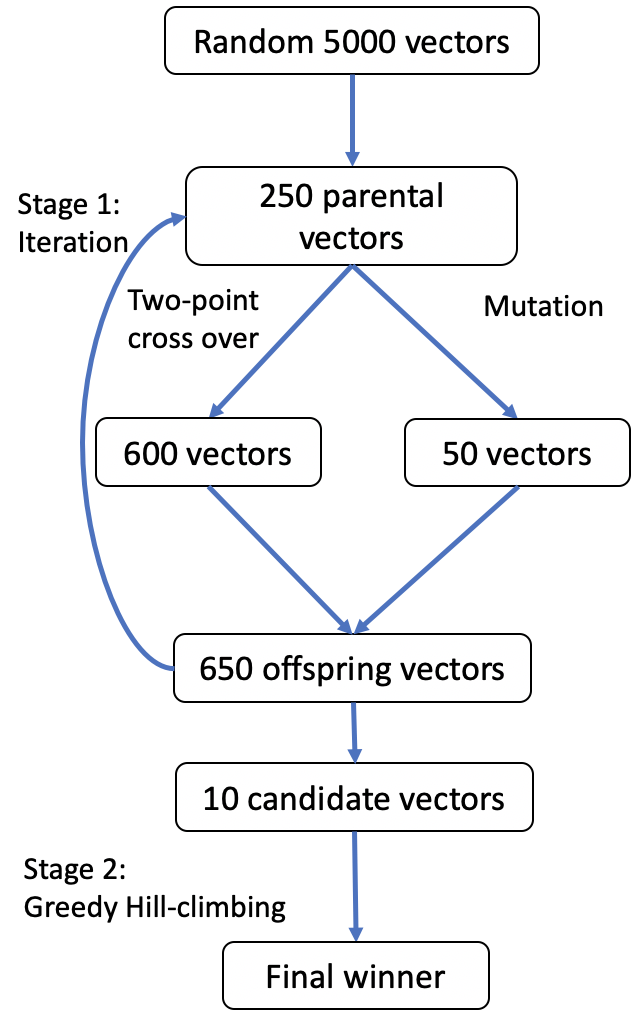
trFOCI optimization for PASL with a genetic algorithm
We developed a genetic algorithm modified from 2010 Hurley et al. to optimize the 11 parameters of the trFOCI pulse. Started from randomly generated parameter vectors, the 11 parameters were optimized with two stages: Iteration and Greedy Hill Climbing. During iteration, new generations were produced by Point Cross-over and mutation; After the group average loss reaches steady, the 10 vectors with the lowest loss were sent to Greedy Hill Climbing, where each of the 11 parameters were adjusted by a small amount randomly, until no further significant improvement. The algorithm can be modified for other multi-dimensional parameter optimization problems.
Environment requirement
This package requires MacOS and Matlab.
Download
The software is free, but we hope that users register to download the software in order to help us track its usage.
Reference
- Kai Wang, Xingfeng Shao, Lirong Yan, Samantha J Ma, Jin Jin, Danny JJ Wang Optimization of adiabatic pulses for Pulsed Arterial Spin Labeling at 7 Tesla – Comparison with Pseudo-continuous Arterial Spin Labeling. Magn Reson Med (Under revision).
Water exchange rate (kw) across the blood-brain barrier quantification toolbox
This toolbox was designed for water exchange rate (kw) quantification and based on Matlab runtime (no license required). This toolbox takes data acquired using diffusion-prepared pseudo-continuous arterial spin labeling (DP-pCASL) sequence developed at LOFT, and generates T1 (tissue), arterial transit time (ATT), cerebral blood flow (CBF) and kw maps. This toolbox implements single-pass approximation (SPA) modeling and total-generalized variation (TGV) regularized reconsrtuction. For more details, please refer to our MRM paper: :Shao, Xingfeng, et al. "Mapping water exchange across the blood–brain barrier using 3D diffusion‐prepared arterial spin labeled perfusion MRI." Magnetic resonance in medicine 81.5 (2019): 3065-3079.
To request this toolbox and sample data, please send an email with your information (also Mac or windows version, Linux not supported currently) to Dr. Danny JJ Wang: jwang71@gamil.com
Baseline BBB kw from 192 cognitively normal participants (age: 8-92 years) can be found in our recent eLife paper: Shao et al., Age-Related Decline in Blood-Brain Barrier Function is More Pronounced in Males than Females in Parietal and Temporal Regions eLife 13:RP96155 (https://doi.org/10.7554/eLife.96155.2), and nii files for CBF, ATT and kw maps can be donwloaded from: https://openneuro.org/datasets/ds005529
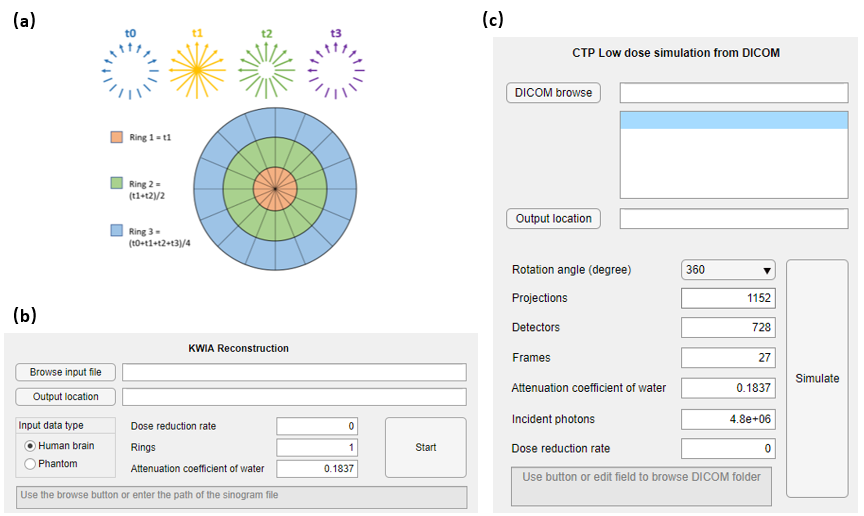
K-Space Weighted Image Average (KWIA) for low-dose CT perfusion
KWIA reconstruction program implements K-Space Weighted Image Average (KWIA), which is an image reconstruction algorithm designed for CT perfusion using a novel projection view-shared averaging strategy (presented in figure (a)) with reduced tube current. Another useful tool, CTP Low Dose Simulation, was designed for simulating low dose sinogram from CTP/CT DICOM images. A brain CTP DICOM dataset and 3 CTP phantom sinograms at 100 kV 60 mA, 120 mA, and 200 mA are provided.
Environment requirement
This program requires Win-X64 system and MATLAB 2018b runtime (automatically downloaded and installed in installation).
Download
The software is free, but we hope that users register to download the software in order to help us track its usage.
Reference
- Zhao C, Martin T, Shao X, Alger J, Wang DJJ, Low Dose CT Perfusion with K-Space Weighted Image Average (KWIA), IEEE TMI 2020
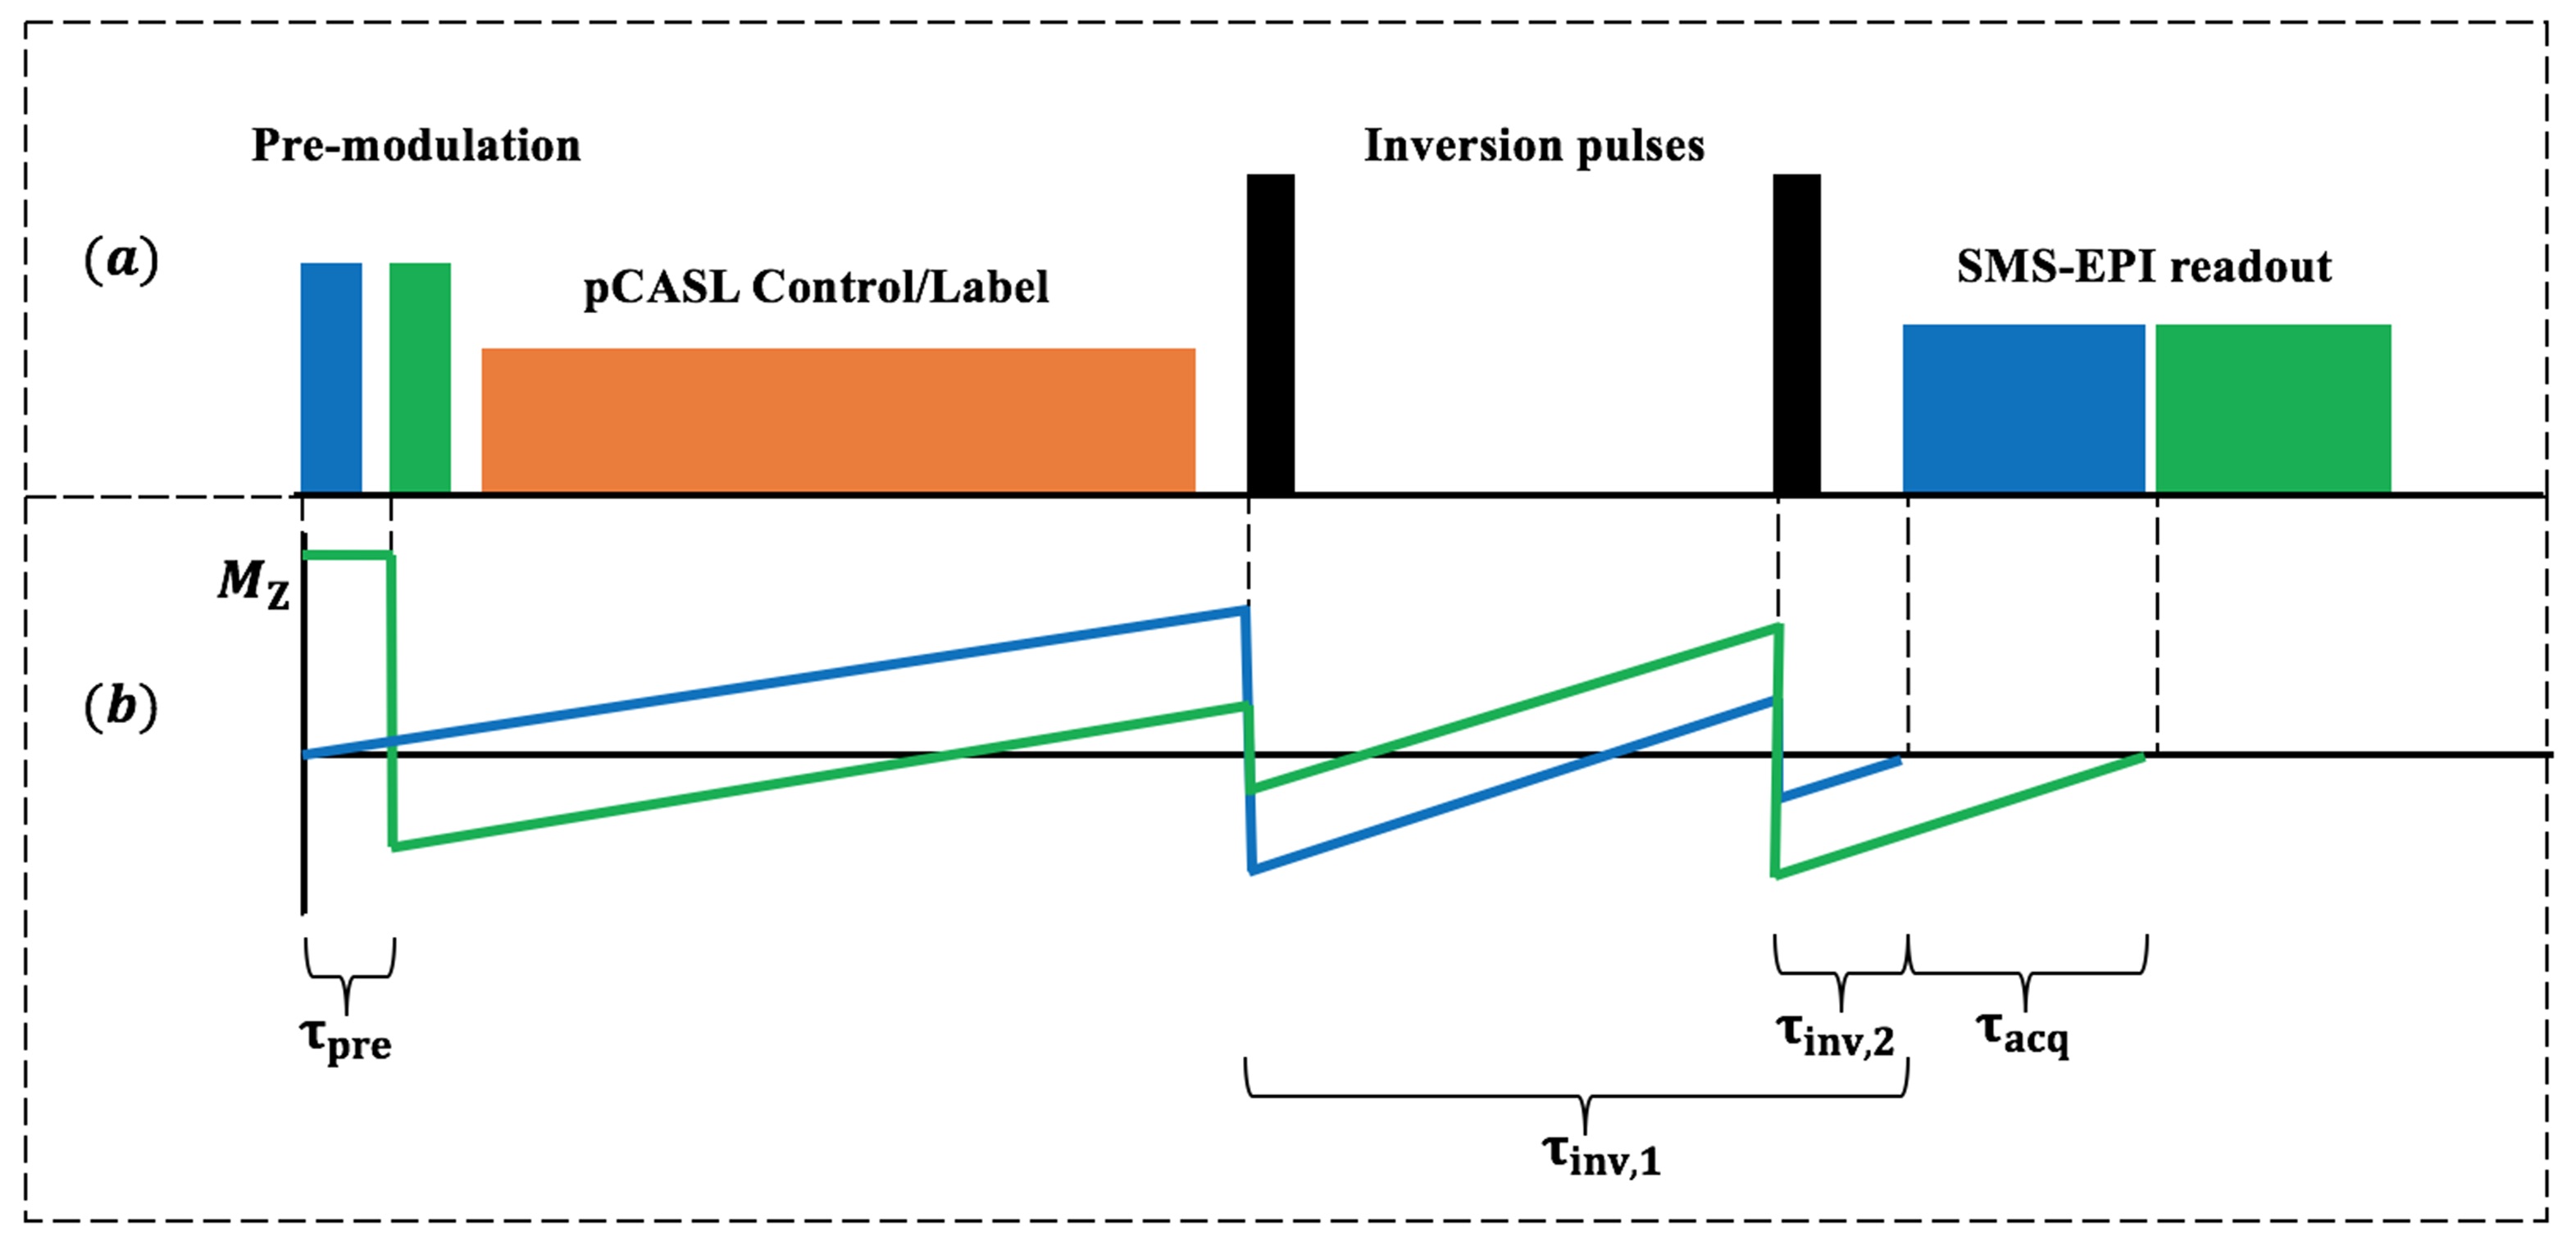
Background suppression for SMS EPI pCASL
We presented a constrained slice-dependent (CSD) background suppression (BS) scheme in 2 dimensional (2D) arterial spin labeling (ASL) using simultaneous multi-slice (SMS) acquisition with blipped-CAIPIRINHA (controlled aliasing in parallel imaging results in higher acceleration). This Matlab tool was designed to simulate parameters (FAs, BS delay, etc.) for a given protocol.
Download
The software is free, but we hope that users register to download the software in order to help us track its usage.
Reference
- Shao X, Wang Y, Moeller S, Wang DJ A constrained slice-dependent background suppression scheme for simultaneous multi-slice pseudo-continuous arterial spin labeling Magn Reson Med (In press).
Complexity Toolbox
© Copyright Laboratory of Functional MRI Technology (LOFT), Department of Neurology, UCLA
Developed by Anitha Priya Krishnan, Jun Fang, Robert Smith, Danny JJ Wang
Complexity Toolbox is a toolkit used to analyze the complexity of resting state fMRI (rs-fMRI) data. The current version includes a pre-processing module and four different methods or modules to calculate the entropy of rs-fMRI:
- ApEn(Approximate Entropy)
- Cross-ApEn(Cross Approximate Entropy)
- SampEn(Sample Entropy)
- MSE(Multiscale Sample Entropy)
- Wavelet-MSE(under development)
Requirement
Toolbox of "Tools for NIfTI and ANALYZE image" is needed, and it can be downloaded from Matlab Central
Download
The software is free, but we hope that users register to download the software in order to help us track its usage.
Reference
- Pincus SM. Approximate entropy as a measure of system complexity. Proceedings of the National Academy of Sciences of the United States of America 1991;88(6):2297-2301.
- Liu CY, Krishnan AP, Yan L, Smith RX, Kilroy E, Alger JR, Ringman JM, Wang DJ Complexity and Synchronicity of Resting State BOLD FMRI in Normal Aging and Cognitive Decline J Magn Reson Imaging. 2013;38(1):36-45
- Richman JS, Moorman JR. Physiological time-series analysis using approximate entropy and sample entropy. Am J Physiol 2000;278:H2039–H2049.
- Costa M, Goldberger AL, Peng CK. Multiscale entropy analysis of biological signals. Phys Rev E Stat Nonlin Soft Matter Phys. 2005 Feb;71(2 Pt 1):021906. Epub 2005 Feb 18.